How to predict the future perfectly every time
also what is this, a dip for ants?!
This is Something Interesting, an independent, ad-free roundup of interesting Bitcoin and economics news along with my commentary and perspective. If someone forwarded you this newsletter, you can get it for yourself by clicking here.
In this issue:
Dear Coinbase: thanks, I hate it
How to predict the future perfectly every time
What is this, a dip for ants?!
Exchange volume soars past previous all time high
Dear Coinbase: thanks, I hate it
One really interesting thing about this recent drop is that it started on Coinbase and spread to other exchanges rather than the other way around. Many of the longer tail of exchanges compete with Coinbase by offering their users greater leverage, and greater leverage means greater volatility when price swings happen. This time, however the movement down started with and was led by Coinbase - likely because Coinbase experienced a partial outage that caused buy orders not to register:
In other words Coinbase was taking sell orders but not taking buy orders. All the algorithmic traders who try and detect and front-run momentum saw Coinbase tanking and moved to liquidate their own positions. Coinbase’s mistaken bearishness became a self-fulfilling prophecy. If you are feeling bad about your own investment take a moment to appreciate that almost $3B worth of leveraged trades were liquidated in the move down. Don’t do leveraged trading, friends.
How to predict the future perfectly every time
With the exciting volatility over this week price movements are back on top of everyone’s mind! So let’s talk about what we know (and what we don’t know) about how Bitcoin’s price might change over time. First, repeat after me!
I am not a financial advisor and this is not financial advice.
If anyone exists who can successfully predict movements in Bitcoin’s price over time, I promise you they are not writing a free newsletter. They are either hunched over a laptop gulping down Redbull or lounging back on a beach chair sipping a daquiri. Some of the people who claim to predict future price movements are liars, some are idiots and most are both. Don’t listen to them.
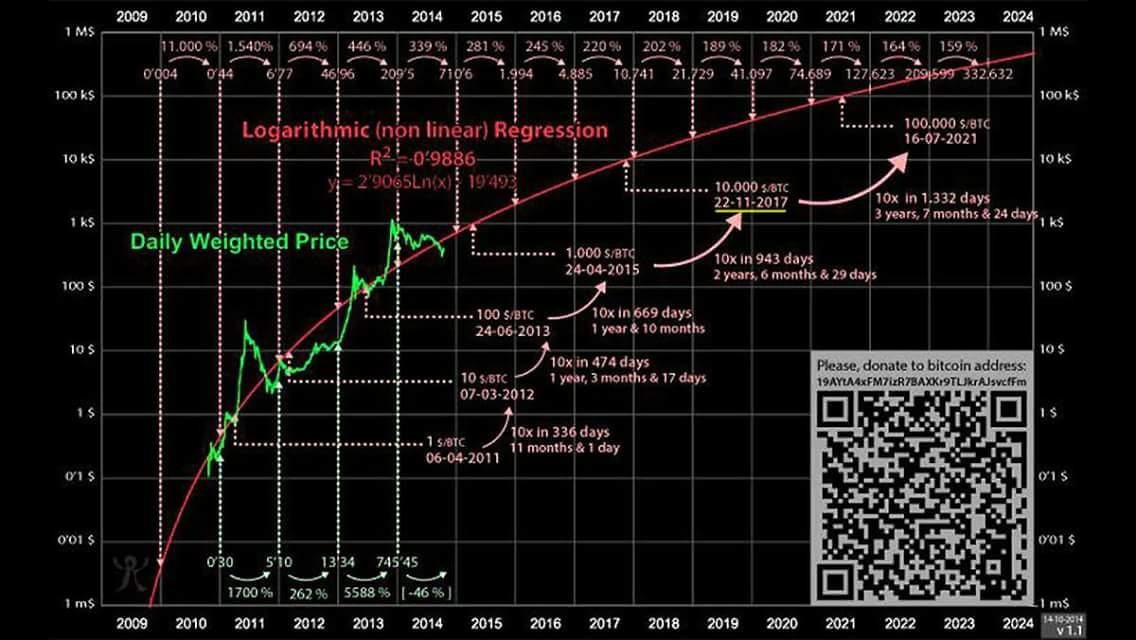
But we all have no choice but to build our own guesses about what Bitcoin will be worth in the future, so it can be instructive to understand other people’s reasoning even if we don’t agree with it. Let’s start with a relatively famous early prediction that was made back in 2014 by a user named trololo:
This is a pretty simple model - he just assumed that Bitcoin was growing exponentially and then fitted a curve to the price data up to 2014 when the graph was published. But it worked surprisingly well! It predicted $10k/btc bitcoin in 2017 (we peaked at $20k/btc) and if you squint a little we are still loosely on track for crossing $100k/btc by the end of 2021. If you checked out the tracking spreadsheet that I shared a few days ago the price prediction graph is essentially doing the same thing but incorporating the additional years of price data since.
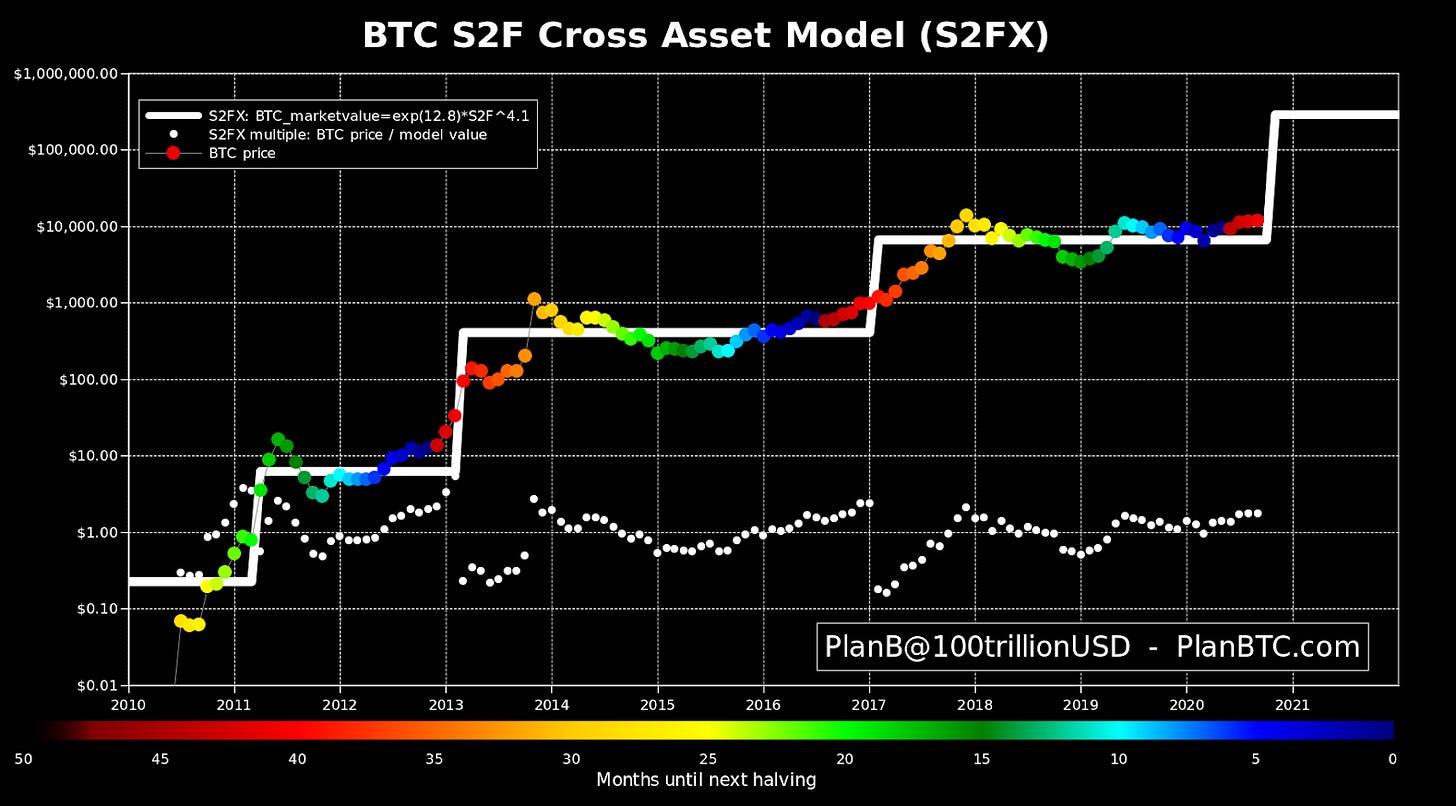
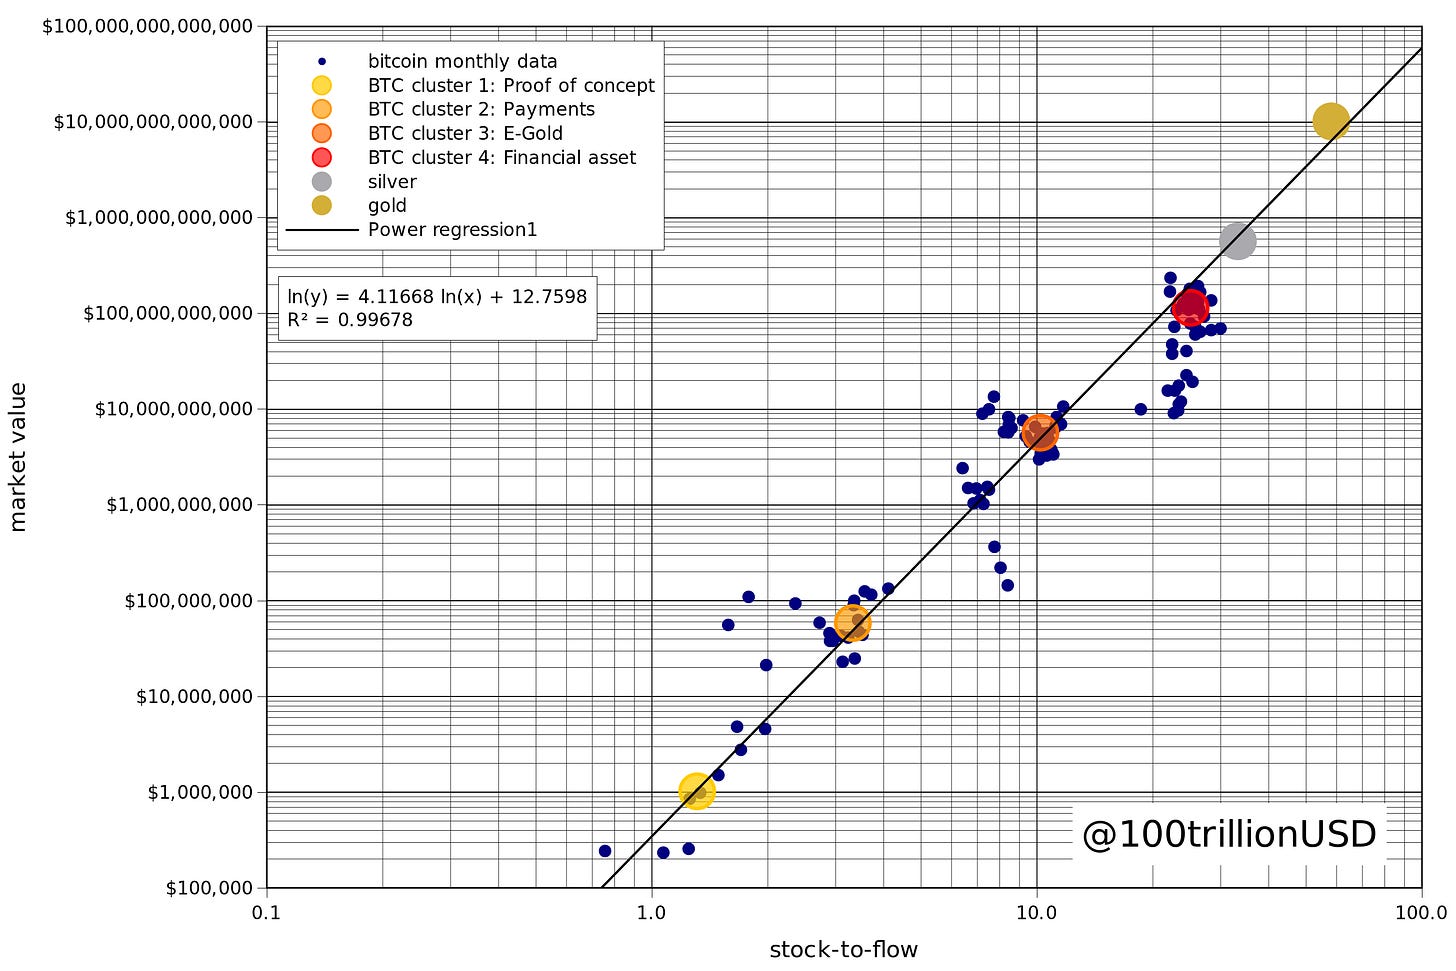
Another more mathematically sophisticated model is @100trillionUSD’s stock-to-flow model, which pretends that Bitcoin is a precious metal and then models the price by comparing it to the ratio of stock (how much Bitcoin already exists) to flow (how much Bitcoin is being mined today). Stock-to-flow is an attempt to quantify Bitcoin’s scarcity and to see how the halving (the process where mining rewards are cut in half every four years) affects price. The resulting prediction looks like this:
These are very fancy and impressive graphs and the math that goes into the models is probably over my head. Looks very convincing and bullish! It is kind of a castle built on a foundation of sand, though. Bitcoin’s supply and time are not independent variables - supply been set as a function of time since the inception of Bitcoin. So if you run a regression based on supply history you’re really just running a regression based on time, because time is the only thing that affects Bitcoin’s supply.
In other words the stock-to-flow model is basically just Trololo’s graph but with more moving parts - it makes the same argument: Bitcoin used to go up so it will probably keep going up too. I don’t think that argument is wrong necessarily but I don’t think the stock-to-flow reasoning is very convincing. For one thing there are a lot of scarce things in this universe that don’t have value - I have boxes full of old Magic The Gathering cards in my closet to prove it. Value is a function of supply and demand, not a function of supply in isolation. The math is a lot fancier but the basic assumption is the same: Bitcoin used to go up exponentially, so it probably still will.
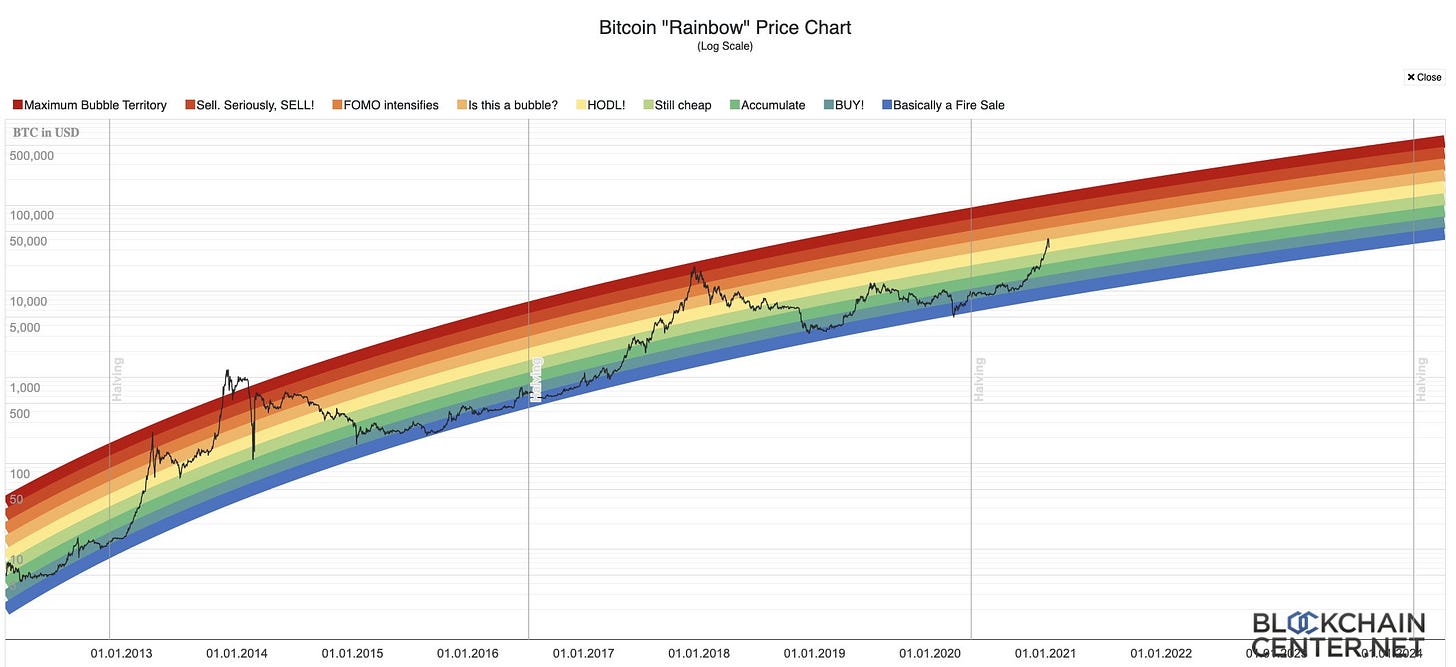
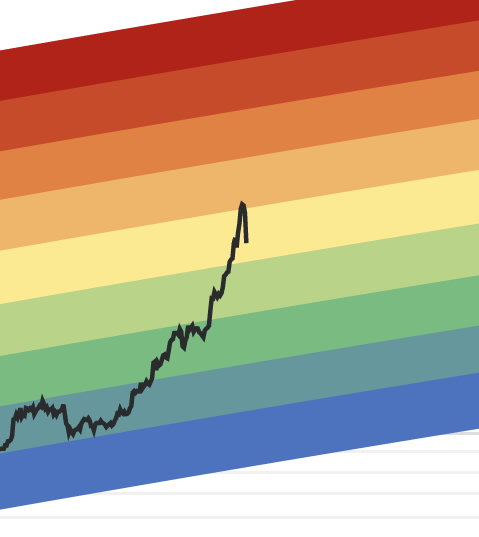
These kinds of predictions crop up periodically and gain some traction with folks who like their hopium to be math flavored. The site moonmath.win tracks a number of them from over the years including what is affectionately known as the "rainbow graph" - the same exponential curve that trololo used back in 2014 but this time with updated data, a wider confidence band and some color coding that honestly doesn’t mean anything at all. The idea here is that when we are in the blue/green parts of the rainbow Bitcoin is underpriced (and should rise) and when the price is in the red part of the rainbow the price should fall.
This is my favorite model for Bitcoin’s price because (a) it seems to be working out empirically pretty well so far and (b) the silly ass rainbow is an excellent reminder that all of these models are just ways to paint optimistic assumptions into pretty pictures. You can do all the fancy modeling you want but it boils down to this: basically all of Bitcoin’s history has been one long bull run. So if you model Bitcoin’s future based on Bitcoin’s history, your model is going to turn out pretty bullish.
Don’t let people dress up assumptions in math and convince you they are facts.
What is this, a dip for ants?!
Now that we have all ridden the Bitcoin rollercoaster a bit this week, let’s talk about dips. A drop of ~$12,000 in a few days is in some ways a startling move (I’m sure it was for newcomers to the space) but in other ways it is completely in character. So far at least this particular lurch is relatively middle of the road in terms of typical corrections downward in past Bitcoin bull markets. If you zoom out a bit that is more obvious. Here is the drop in the context of our long term rainbow graph above:
Until recently the vast majority of Bitcoin traders were small scale retail traders who tend to herd together and produce dramatic swings up and down as they rapidly flip back and forth between fearful and greedy. In this market there is growing evidence of true institutional demand, and institutions have longer time horizons and more discipline about following through on their plans. Long term, deep pocketed investors may very well change the shape of the next curve relative to previous ones.
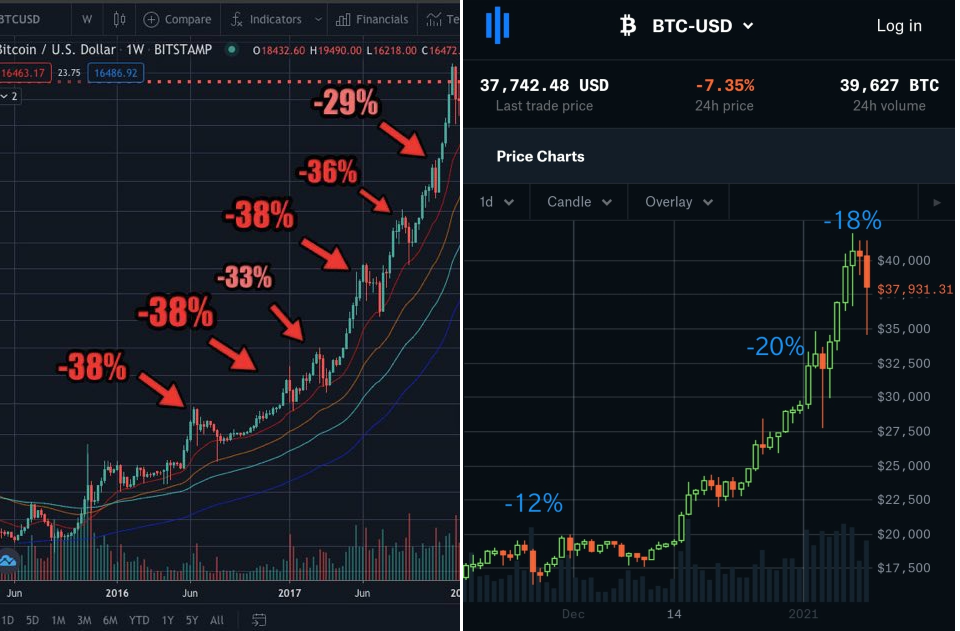
If we compare the drops so far with the drops on the previous run up they are actually relatively modest so far. Pictured below are the 2017 dips on the left and the last two months or so on the right. This is why experienced Bitcoiners are unalarmed. This actually isn’t that big a drop yet.
So that could mean one of several things. Maybe we haven’t finished dropping yet. Maybe drops on this bull run will be smaller. Or maybe this bull run is such a different size that we actually haven’t seen a real drop yet.
Exchange volume soars past previous ATH
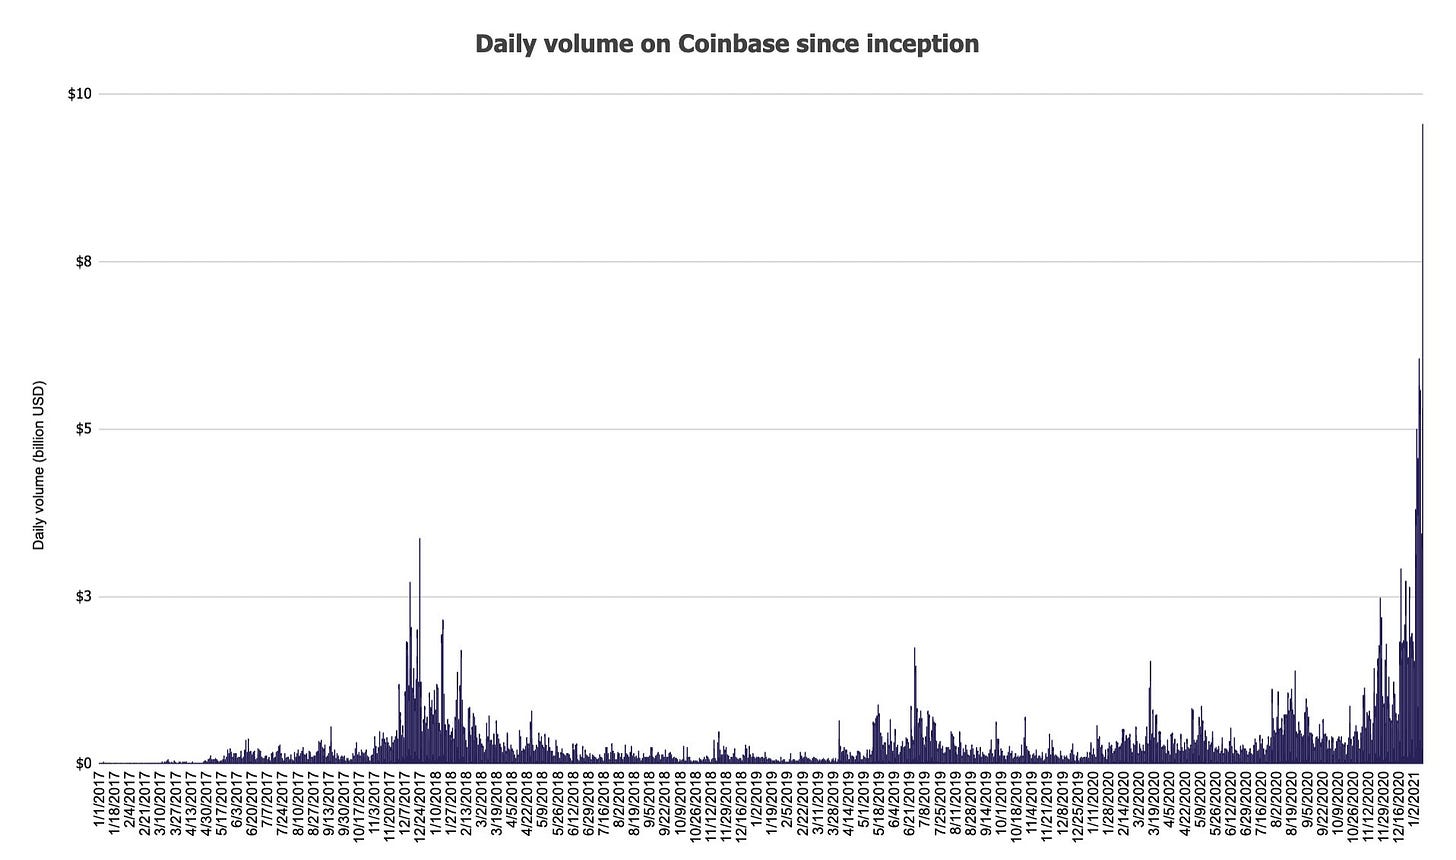
The volatility may be making new holders nervous but the exchanges themselves are making money hand over fist. Exchange revenue is mostly from trading fees, so they make money on rapid movements whether the price moves up or down. Coinbase cleared more volume on Monday than they did in Q1 of 2019. These are absurd growth numbers to be going into an IPO with - one imagines the hype will probably attract new investors to the entire crypto asset class.
That much Bitcoin changing hands means a lot of weak hands were shaken out and replaced with more confident investors (you have to be confident to catch a falling knife like that). In the long run that is almost certainly bullish. Another way you can see that is by watching where coins that move are actually going.
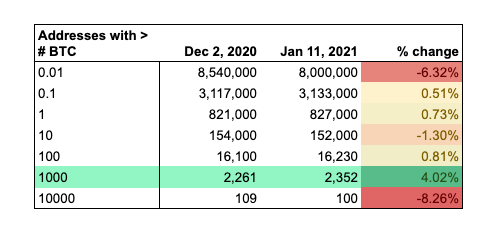
In this past month we saw outflow from addresses with >10000 btc (mostly exchanges) and addresses with <10 btc (mostly retail) mostly into addresses with 1000-10000 btc - between $34-340M at time of writing. One possible explanation might be institutions accumulating large stakes from retail sellers and moving their purchases off-exchange for long term storage. But who knows? No way to be sure.
Other things happening now:
Forbes published a glowing profile of Bitcoin billionaires at 1/11/2021 at 11:00 am PST when the price had crashed ~25% down in the last 24 hours. Seems likely at least some of those billionaires lost their title between writing and publication.
Presented without comment:


